Tufts' Kevin Christmas.

Beyond the Basics: Advanced Metrics That Define Every D-III Men's Top 20 Team

February 9, 2024
Zack Capozzi
Rich Barnes

Advanced metrics are common in other major sports, and Lacrosse Reference is helping to make them mainstream in lacrosse.

Lacrosse Reference goes beyond the box score. Beyond the basics, if you will.

Lacrosse Reference was created in 2016 with the goal of bringing the analytical methods used in other sports to college lacrosse. The site’s focus has been on finding innovative ways to compare teams and players that are more nuanced than the broad-brush metrics that were common at the time.

Analytics expert and Lacrosse Reference founder Zack Capozzi is back ahead of the Division III men’s season to provide insights on one advanced metric per Top 20 team.

For a glossary of terms, head here.

Related Article
Salisbury Opens 2024 No. 1 in Preseason Top 20
Read More

1. SALISBURY

Coming off the 2023 title run, Salisbury’s ramped up their non-conference slate, which is projected to be the 18th toughest, up five spots from the previous year’s 23rd. The real battles for the Gulls are in-conference, obviously, which is why their overall SOS is projected to be 2nd. Still, the fact that their out-of-conference matchups are tougher than a year ago shows how little interest the staff has in resting on their laurels.

2. CHRISTOPHER NEWPORT

The Captains enter the season with a deep and experienced roster, featuring 61 players and a returning core responsible for 95% of the previous year’s offensive output. The team’s portal activity, including the addition of transfer Duncan O’Brien, and the retention of key players like Andrew Cook and Brett Jackson, promise to sustain their high-octane offense, which previously ranked in the 98th percentile for opponent-adjusted efficiency. This depth, combined with the proven defense and faceoff specialists, positions the Captains favorably for championship contention. Assuming they’ve figured out how to counteract the maroon and gold kryptonite that is Salisbury.

3. RIT

Not many teams have such a large split between their opponent-adjusted and raw defensive efficiencies. But RIT faced a really strong set of offenses in 2023. As a result, if you just looked at their raw efficiency (goals allowed divided by defensive possessions faced), they look like a 66th-percentile defense. The best of the average defenses. But apply the opponent-adjustment to account for the fact that they played such strong offenses, and they were actually the 9th-best defense in the country.

4. LYNCHBURG

For Lynchburg, shooting was a critical success factor, as its record attests: 12-2 when its shooting percentage finished above 26.5%, compared to 0-5 when falling below this threshold. In the 14 games with a shooting percentage above 25.6%, Lynchburg’s overall offensive efficiency was 34% versus 22% when it was below that mark. Turnovers weren’t the issue for this offense, it was creating, and then finishing, high-quality shots.
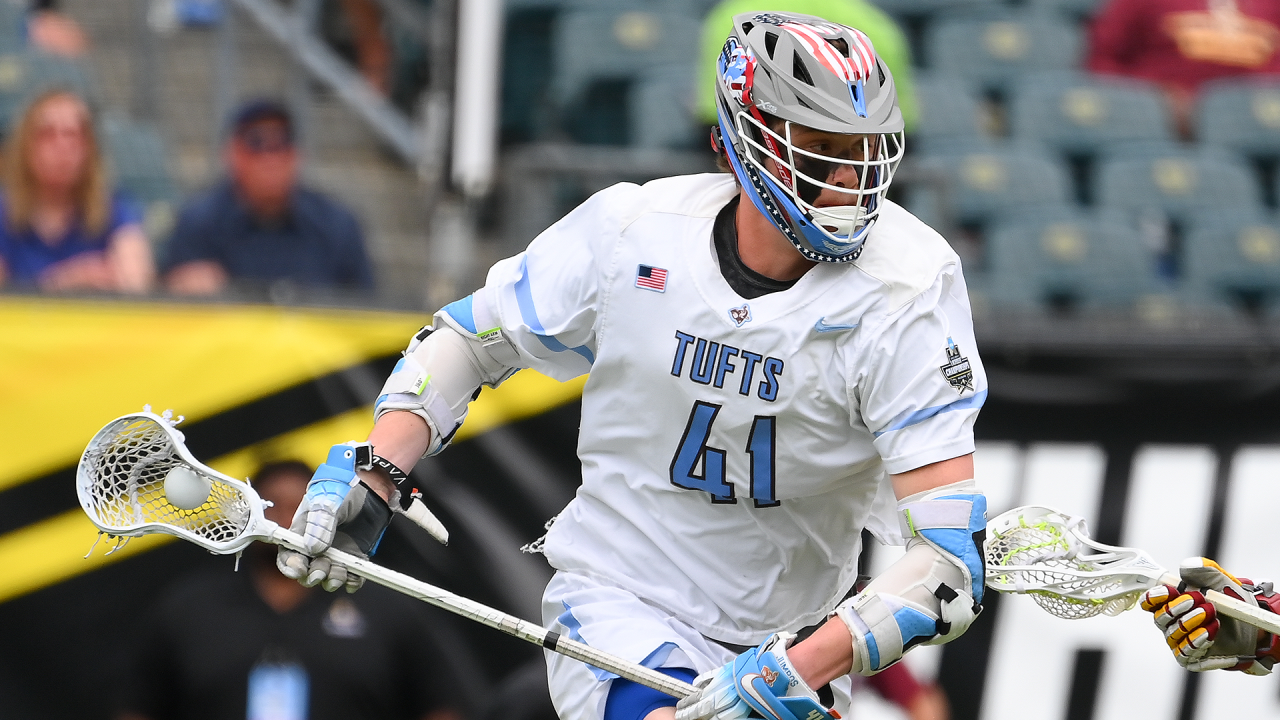
5. TUFTS

The Jumbos really ramped up their game by scheduling what projects as the most challenging non-conference lineup in the nation. That is a step up from last year’s 6th-place in non-conference schedule strength. This not only demonstrates the team’s ambition but also serves as a potential boost for their postseason credentials, given the importance of strength-of-schedule in selection considerations. With an overall schedule ranked as the 2nd-most difficult, the Jumbos are clearly setting their sights on proving themselves against top-tier competition and solidifying their reputation as a powerhouse.

6. BOWDOIN

Bowdoin’s schedule represents a big step up in non-conference difficulty. Bowdoin dropped Emerson and Nazareth, the 145th- and 70th-rated teams in the country, according to the LaxElo model. And it added MIT, which is currently LaxElo’s 28th-rated team. It was a very solid 2023 for Bowdoin, and it’s stepping up the challenge accordingly.

7. MIDDLEBURY

Combing through the Middlebury splits last year, you notice that the Panthers’ shooters were more or less in line with the national average in every segment of the shot clock. Their biggest outlier was on shots with 20-40 seconds left on the shot clock. They shot 30% on these shots, and the national average was 26.5%. And that’s not a very large gap. What is interesting, though, is that they took 34.7% of their shots early, with less than 20 seconds gone on the shot clock, compared to the national average of 29.9%. And they were less likely to shoot with between 20-60 seconds left on the shot clock. Pedal to the metal.

8. YORK

York has a non-conference schedule that projects as one of toughest in the entire country — if not the toughest overall. At this point, it’s part of this program’s DNA. Last year’s non-conference slate ranked 2nd in difficulty. And with an overall strength-of-schedule that projects as 11th-most difficult nationally, they’ll be relying on a trial-by-fire to motivate a bounceback season.

9. AMHERST

The Mammoths are set to face a challenging and intriguing 2024 schedule. The schedule’s non-conference slate projects as the 16th-toughest nationally, easing slightly from the 2023 slate, which ranked 11th in terms of difficulty. Of course, their conference slate is always tough, and this year is no different. Overall, their full schedule, including conference and non-conference games, projects as the 11th-toughest in the country, same as last year. The non-conference may have eased a slight bit, but this is still a gauntlet of a schedule.

10. UNION

The 2024 schedule for Union will be grueling, projecting as the 2nd-toughest overall and featuring a more challenging non-conference lineup. Given their LaxElo rankings (54th vs. 146th, respectively), swapping Muhlenberg for Emerson was enough to bump their projected non-conference strength of schedule from 29th in 2023 to 14th this year. Other than that, they’ll play 14 teams that were on the schedule last year and against whom they went 10-6. Run it back!

Related Article
USA Lacrosse Division III Men's Preseason All-Americans
Read More

11. GETTYSBURG

Gettysburg’s success last year was tightly coupled with the output of their attack unit. With roster turnover, there’s no guarantee that this trend will hold up, but it was striking enough to be worth noting. Last year, in the nine games when the Gettysburg attack scored four or more goals, Gettysburg’s record was 9-0. In the four games when the attack failed to reach four tallies, they didn’t win a game. Stop the attack, stop the Bullets.

12. DICKINSON

Heading into the new season, Dickinson is buoyed by its significant roster depth and exceptional faceoff expertise. With 99% of faceoff experience returning, including John McKee’s impressive 64.1% win rate and 20th-place finish in our FOGO ratings, the team is well-positioned to maintain control of the flow. Whether that makes up for the losses on defense remains to be seen.

13. WESLEYAN

Wesleyan’s non-conference schedule has been significantly ramped up, projecting as the 22nd toughest this year. This is a considerable jump from last year’s 53rd-ranked non-conference schedule. The introduction of Roanoke and Stockton to the schedule, with respective win probabilities of 59.7% and 24.6% for Wesleyan, replaces the likes of Coast Guard and SUNY Maritime, against whom Wesleyan had a combined 6-0 record in the shot clock era.

14. DENISON

Denison faces a significant challenge in the cage, returning only 5% of last season’s saves after the departure of Archer Darrach, who had a save percentage of 55.2%. The responsibility now falls to a less experienced goalkeeper. The options for the staff would appear to include Andrew Albert, Will Creevy and freshman Brant Satterly. With the defensive unit ranked in the 89th percentile for opponent-adjusted efficiency, the performance of whoever they put in cage will be critical to Denison’s continued defensive stability.

15. ST. LAWRENCE

The introduction of new opponents like Rhodes, Christopher Newport and York into St. Lawrence’s schedule marks a significant shift from the previous year, adding an element of unpredictability since they have not played any of these teams in the shot clock era. The LaxElo projections currently give St. Lawrence win probabilities of 89.5% against Rhodes, 23.5% against CNU and 16.9% against York. This recalibrated schedule, rising from the 35th- to the 13th-toughest non-conference slate, will test the theory that trial-by-fire is the best way to prepare a team for postseason success.

16. WASHINGTON AND LEE

The Generals face a daunting schedule, but this rigorous lineup could be the crucible that forges a championship-contending team. The highlight is the March addition of a tilt with RIT. They’ve swapped out three opponents in total, which is a big part of why their non-conference slate projects as the 25th-toughest nationally, up from 47th a year ago. They over-performed expectations last season, and with a tougher slate, they’ll need to do it again to maintain their standing.

17. HAMPDEN-SYDNEY

Hampden-Sydney’s defense not only ranked 6th nationally in 2023 but also excelled in creating turnovers, with an opponent-adjusted turnover rate of 50.8%, the 2nd best in the country. Their ability to force turnovers was a critical part of their approach, as shown by their 9-0 record when the opposing offense had an assist-to-turnover ratio lower than 0.45. However, when this ratio exceeded 0.45, the team’s record dipped to 1-2, indicating that their outcomes were significantly tied to the defense’s ability to disrupt the opponent’s scheme. Live by the turnover, die by the turnover.

18. GROVE CITY

Grove City is bracing for a rigorous non-conference schedule, projected to be 2nd nationally in terms of difficulty. It’s wild that, despite the removal of five teams against whom they had a 3-12 record in the shot clock era, their non-conference SOS is projecting to rise to 2nd, up from 22nd last season. Adding RIT and Salisbury will do that. Go big or go home.

19. SWARTHMORE

Von Mabbs’ rise in Swarthmore’s offensive pecking order is underscored by his increased usage rate, jumping from 8.5% to 14.3% from 2022 to 2023. He was also responsible for 20% of the team’s assists, up from 12% in 2022. His ability to take care of the ball, improving from the 32nd percentile in ball security to the 56th a year ago, was crucial to the staff building trust in his playmaking abilities. It wasn’t perfect; he still had a four-game stretch during which his ball security was in the 16th percentile, but no other aspect of his game was as responsible for his breakout last season.

20. MUHLENBERG

The growth in individual roles, particularly in the case of Jack Kraemer, who saw his individual efficiency jump from the 14th to the 43rd percentile, played a significant role in shaping Muhlenberg’s offensive dynamic in 2023. Kraemer’s development into a more effective facilitator with a higher per-touch assist rate opened new options for the team. Whether he can carry that forward, especially as they lose James Dalimonte to Penn State, is one of the central questions for this team.