College Women
Final
Mar 31

COR

UNH
Final
Mar 31
03:00 PM
Mar 31
12:00 PM
Apr 1
01:00 PM
Apr 1

03:00 PM
Apr 1

05:00 PM
Apr 1
07:00 PM
Apr 1

12:00 PM
Apr 2

12:00 PM
Apr 2

01:00 PM
Apr 2

01:00 PM
Apr 2

03:00 PM
Apr 2
03:00 PM
Apr 2

03:00 PM
Apr 2

03:00 PM
Apr 2
04:00 PM
Apr 2

04:00 PM
Apr 2
04:00 PM
Apr 2
04:00 PM
Apr 2

04:00 PM
Apr 2
04:00 PM
Apr 2

05:00 PM
Apr 2
06:00 PM
Apr 2


06:00 PM
Apr 2
06:00 PM
Apr 2
03:00 PM
Apr 3

06:00 PM
Apr 3

07:00 PM
Apr 3
Roster construction and lineup maximization are hot topics in the NBA. With the wealth of knowledge SportVU cameras and other technologies provide the basketball world, analysts have been able to identify the key components commonly found in the best lineups.
Steve Shea and Chris Baker found that the best NBA lineups have three strong 3-point shooting threats, though such lineups are extremely rare.
“In a basketball offense, 3-point shooting is not in competition with penetration. Instead, 3-point shooting and penetration are perfect complements,” wrote Shea and Baker. “When an offense is a serious threat to attack at the rim (through drives, post ups or cuts), the opposing defense must consider playing more compact and bringing help defenders near the lane. When a team has good 3-point shooters stationed around the perimeter, the help defenders off the ball must play tight to their men so that they do not give up an open catch-and-shoot 3 on a kickout.”
The same concepts apply to lacrosse. Build an offense with six finishers, and you’ll struggle to get them open in a position to finish. On the other hand, if you build an offense of only dodge-to-shoot players, then you may not be cashing in on as many step-down shots as you should be.
Below is a chart of all players who took 15 or more shots (and at least 2 shots per game) in the 2016 Major League Lacrosse season. The size of their data points corresponds to how many shots per game they took.
Quadrants are broken out by league average shooting percentages. In dodge-to-shoot scenarios, the league average was 26.85 percent; in catch-and-shoot scenarios, it was 34.07 percent.
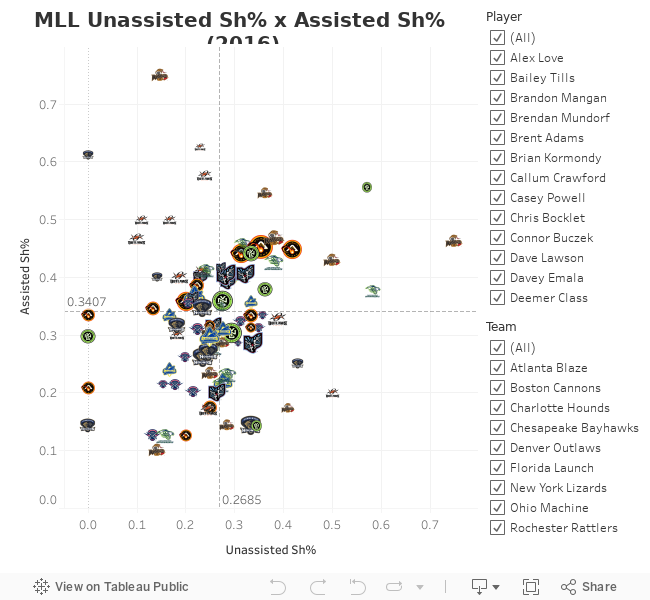
Poke around with the filters for players and teams, and you’ll find some interesting clusters. Unsurprisingly, the notoriously unselfish reigning MLL Champion Denver Outlaws have some of the best catch-and-shoot players (Wes Berg, Matt Kavanagh, Eric Law, Michael Bocklet) all found in the top left quadrant.
Nylon Calculus’ Ian Levy built a similar table to this, examining the true shooting percentage on pull-up shots and the true shooting percentage on drives across the NBA.
There’s tremendous value in having players who excel at both. Take a look at the top four most efficient offenses (New York Lizards, Ohio Machine, Rochester Rattlers and Atlanta Blaze). The Lizards, Machine and Rattlers each have four players in the top right quadrant; the Blaze only has three, but those three happen to be Kevin Rice, Randy Staats and Mark Matthews, who take more shots than anyone else on the team.
The bottom right quadrant warrants further investigation. While there are plenty of players on the left side of the table who excel as passers, this group to the right is comprised of players who demand a slide. In the bottom right, they might not knock down catch-and-shoot looks at a high rate, but that might not matter as much as it does in basketball.
“There have been fewer studies on the ideal number of creators sharing the floor,” writes Nylon Calculus’ Andrew Johnson, “though the general thought seems to be that there is a quicker declining advantage with shot creators.”
There’s more space on a field than a court, and often times the threat of an immediate re-dodge is enough to prevent defenses from sliding from a player like Drew Snider, Peter Baum or Steve Pontrello. Dressing too many players incapable of draining a 3-point shot can seriously hurt a basketball offense; I’m not sure that you can have too many players in lacrosse whose best skill is to blow by a defender for an open shot. It’s one of the most coveted skills in the league.
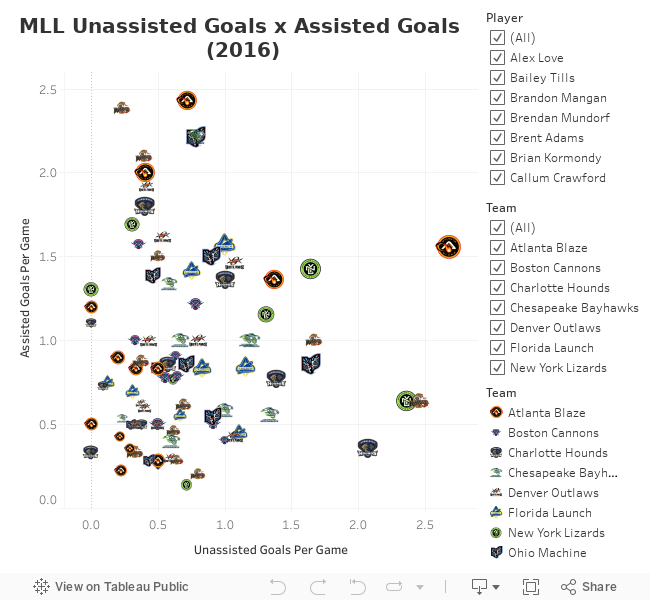
For a different perspective, here are the same players plotted by unassisted goals per game and assisted goals per game.
As we continue to compile MLL shooting data, some of the questions prompted by this table will be answered. Enjoy changing up the filters and finding your own takeaways, and of course, feel free to send me suggestions for the next table you’d like to see.