Beyond the Basics: Advanced Metrics to Describe Every D-I Men's Top 20 Team
Lacrosse Reference goes beyond the box score. Beyond the basics, if you will.
Lacrosse Reference was created in 2016 with the goal of bringing the analytical methods used in other sports to college lacrosse. The site’s focus has been on finding innovative ways to compare teams and players that are more nuanced than the broad-brush metrics that were common at the time.
With the 2023 season beginning this weekend, these are the metrics that matter about the teams in our Nike/USA Lacrosse Division I Men’s Preseason Top 20.
For a glossary of terms, head here.
1. VIRGINIA
The Hoos will have to replace Matt Moore and as the guy with the second-best individual player efficiency rating on the team, and that will be no small feat. But the thing that you go back to when looking at their stats is how little any given player matters to their success. Four different Cavaliers took at least 10 percent of their shots. But the offense isn’t the issue here; of UVA’s four worst defensive performances, three were losses.
2. MARYLAND
My favorite new stat for the 2023 season is on-goal shooting percentage. We tend to think of shooting percentage is reflecting a goal or no goal outcome, but that’s wrong. Shots that are missed off-cage are much less damaging to an offense than shots that are saved by the goalie (and likely sent the other way in transition). A team that has more of their misses off-cage rather than saved will be a more efficient offense. So we need an on-goal shooting percentage stat to tell us how a team does on high-leverage shots, the ones that are on-cage. And last year, part of the Terps’ offensive brilliance was just that. They led the country in on-goal shooting percentage: 58.9 percent of their shots on-cage found the back of the net.
3. GEORGETOWN
We saw what Rutgers did last year with a bunch of incoming transfers, and now we get to see if Georgetown can do something similar with Tucker Dordevic coming to town. It’ll be a new look Hoyas offense with Dylan Watson, Connor Morin and Alex Trippi all moving on. But with the addition of Dordevic and friends, Kevin Warne is bringing in the second-most transfer production of anyone in Division I men’s lacrosse. Ultimately, though, this is not a team for whom the underlying statistics are that relevant. They’ve been great over the past two seasons, right up until they weren’t. Not to dredge up bad memories, but the projections had Georgetown with an 86.8 percent chance to beat Delaware last May. They’ve got the tools. Can they get over the hump this year?
4. CORNELL
John Piatelli has moved on, and the Cornell offense would seem to be at a crossroads. When Jeff Teat was on campus, the offense finished no worse than second in opponent-adjusted offensive efficiency. Last year, after their run to the finals, they finished 11th. Does the Cornell offense jump back into the top 10 with all that they return from last year’s runner-up squad, or does losing Piatelli condemn them to a further slide? Keep an eye on Aiden Blake as a replacement for some of Piatelli’s shots. He finished in the 96th percentile for on-goal shooting percentage and the 94th percentile for individual player efficiency.
5. PRINCETON
With the potential for 14 games (including the two Ivy League tournament games) on their brutal schedule, the debate is whether the Tigers will end up with eight-plus wins or settle for seven or fewerr. Outside of their first two tune-up games, Princeton’s schedule is very tough, with games against the reigning national champs, the reigning Big East champs and another Final Four team in Rutgers.
6. NOTRE DAME
Notre Dame finished the 2022 season with a 3-4 record against RPI Top 20 teams. They were 2-3 against the RPI Top 10. Compare that to Virginia, which was 1-3 against the RPI Top 10, but 5-4 against the RPI Top 20. Or Brown, which was 3-3 against the Top 10, but 3-5 against the Top 20. And what about Duke’s three losses to teams outside the RPI Top 20? The point that I’m trying to get across is that using the bucketing system in place now makes it very difficult to compare the impressiveness of different teams’ records.
Another technique uses a point system to credit teams for the quality of their wins and losses by adding up the value of the RPI ratings of their victories (inverted of course) and subtracting the RPI ratings of their losses to come up with an RPI Strength-of-Record that doesn’t rely on buckets. By this metric, Notre Dame had the ninth-best RPI SOR (on a per-game basis). Of course, all of this is complicated by the fact that different teams played different numbers of games. If you use this same method, but use the total points (instead of dividing by games played), the Irish fall to 15th.
7. DUKE
When I peruse the old database, Dyson Williams’ 2022 season ranks among the most impressive shooting seasons I can find. In Division I men’s lacrosse, going back to 2015, there have been 1,842 player seasons in which someone averaged 4 shots per game and took at least 40 shots for the entire season. In only 32 of those seasons did the player’s on-goal shooting percentage rank higher than Williams’ 2022 mark of 70.5%. Last year, the only players who bested him by this metric were Brayden Brown (Bellarmine), Jake Taylor (Notre Dame) and Bobby Abshire (Army).
8. YALE
No disrespect to Matt Brandau, who absolutely deserved every accolade sent his way last year. But you could make an argument that Chris Lyons should have gotten an equal share himself. Very few players filled up the stat sheet like Lyons did last year. Here’s the list of players who accomplished the following feats in 2022:
— Shot at least 37%
— Recorded at least 12 assists
— Had fewer than 13 turnovers
— Picked up at least 17 ground balls
Chris Lyons. That’s the list.
9. PENN
As we all know, a shot that a goalie saves is akin to a turnover. The momentum in a game can turn on a dime after a save in a way that that few other on-field events can cause. But until this offseason, I’ve never really measured the offensive side of that coin. We calculate shooting percentage, but we don’t have a separate measure for the high-leverage shots that are either saves or goals. And when we do remove the off-cage misses, some teams rise to the top like a weird on-goal shooting cream. Penn was one such team; of its on-goal shots, 54.2% of them ended up in the back of the net. That was the fourth-highest mark in all of Division I. Of the higher-volume shooters, Sam Handley led the way with a 56% onGoal Shooting percentage. That was good for the 76th percentile among qualifying players last year. Handley was a good example of why relying on shooting percentage can be misleading. He had a relatively low shot-on-goal rate, which meant that a relatively small proportion of his shots were high-leverage shots. As a result, his overall shooting percentage was middling (28%, 49th percentile), which gives an unduly poor impression of his actually very impressive shooting efficiency.
10. RUTGERS
As an outside observer, it’s always dangerous to ascribe statistical outcomes to coaches emphasizing a certain aspect of the game. And frankly, given the turnover on rosters, it could always just be that a different mix of players produces different profiles in the numbers. But the trend in Piscataway since the end of the 2019 season is begging for some sort of explanation. The Scarlet Knights finished that season with a 28.5% turnover rate. In the COVID-shortened season of 2020, that number was 26.3%, then 24.3% in 2021. Last year, they finished with the lowest turnover rate in the country at 23.2%. That’s a big part of the reason that the offense finished eighth despite having just the 16th-best shooting percentage.
11. OHIO STATE
Of the topline numbers, you might think that the Buckeyes’ seventh-rated opponent-adjusted offensive unit would be their crown jewel. You’d be wrong. Their faceoff unit finished the year sixth nationally, and fourth after you account for the quality of the opposing FOGOs (62.1% adjusted win rate). But if Ohio State is going to make another run to the NCAA tournament, it’ll have to hope that Drew Blanchard can replicate the success that the now-graduated Justin Inacio put together during his time in Columbus. The good news is that the drop-off from Inacio to Blanchard may not be that steep. Inacio finished 2022 as the 19th-rated FOGO, according to the Faceoff Elo ratings; Blanchard was 34th.
12. BROWN
Ah, life in the Ivy League. The annual exodus of eligible-according-to-the-NCAA but ineligible-according-to-the-Ivy-League players hit the Brown Bears especially hard this year. The Bears return just 52.4% of their production (as measured by EGA). Even within the Ivy League, that is very low. Dartmouth had the next-lowest figure with 70% returning. It’s even more striking in their assist numbers; just 47% of their team assists were by players who are still on the roster this year. If they are able to keep up the momentum from last season, it will likely be because Trevor Glavin continued to post stellar efficiency numbers in an expanded role. Here’s a taste of his 2022 campaign: He had eight assists over seven games, which given his limited role, works out to an assists-per-touch rate that is in the 98th percentile overall.
13. DENVER
There is no doubt that the Pios have a tough challenge ahead in replacing Jack Hannah, Alex Simmons and Ted Sullivan. If you look at the percentage of the points scored by Denver last year, just 39% of that point production is back for 2023. But if you look at overall production (in the form of expected goals), the story is not quite as bleak; as measured by returning EGA (expected-goals-added), 50% of their production is back this year.
14. DELAWARE
Perhaps no team has more momentum coming into the 2023 season than Delaware. The Blue Hens are coming off an unexpectedly good playoff run and return four different players who finished in the top-100 of the EGA rankings (Mike Robinson, 35th; JP Ward, 67th; Tye Kurtz, 71st; Logan Premtaj, 86th). The biggest challenge on the offensive end is replacing the production from current Michigan volunteer assistant Mark Bieda, who produced 21% of the Hens’ assists last season.
15. HARVARD
“What’s Harvard going to do for an encore?” is one my favorite questions heading into the 2023 season. This is a team that has basically everyone back with the exception of Austin Madronic. And to fill that hole, they’ve got a potential break-out player in Nick Loring. He hasn’t seen the field as much under the new coaching staff, but his fundamentals last year were impressive. As an initiator, his assists-per-touch number was in the 97th percentile, and his ball security rating was in the 72nd percentile. If he can put a few less shots into the goalie’s chest, you’ve got a very efficient replacement for Madronic in the rotation.
16. BOSTON U
EGA is my metric for overall player production. It's like WAR in baseball or PER in basketball. It takes all the good and bad things that a player does and puts it into a single number. And since it’s an all-in-one metric, it’s a good way to look at returning production. And for fans of the Terriers’, EGA paints a very rosy picture. Coach Polley’s crew returns 98.6% of their production from last year (as measured by EGA).
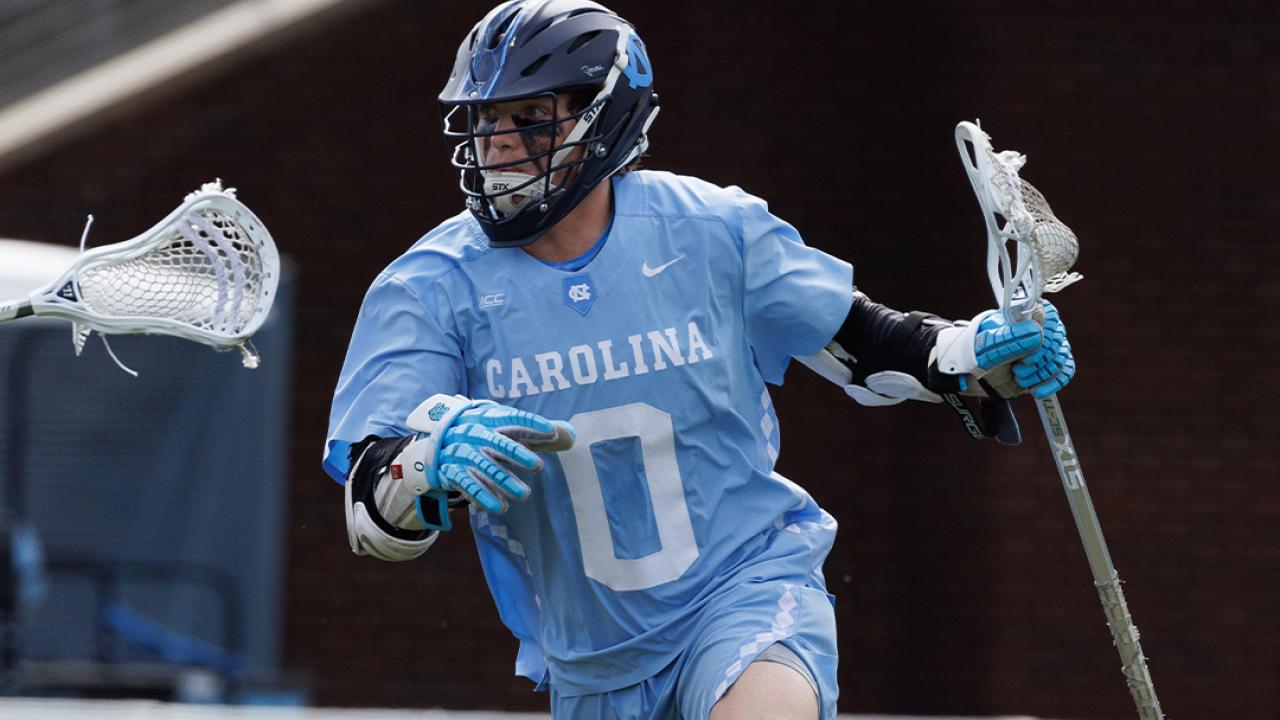
17. NORTH CAROLINA
It may take a while for fans and announcers to get the hang of watching UNC this year. With the departures of several seniors and a few transfers here and there, the Heels are returning just 37% of their production from last season (as measured by EGA). Obviously, Chris Gray accounted for a lot of that. His 63.9 total EGA put him 15th in all of Division I last year.
18. JACKSONVILLE
Perhaps no team had the widest gulf between their best performances and their worst performances last year. From an offensive perspective, in their 14 wins, the Dolphins’ offense scored goals on 38% of their offensive possessions; in their 3 losses, it was just 24%. The gap is not as wide on defense, though. In 14 wins, their defense allowed a goal on just 20% of opposing possessions. In three losses, it was 31%.
19. NAVY
Patriot League coaches can contradict me, but it seems like the Mids’ defense was no fun to play against last year. Nationally, the defense ranked 17th in opponent-adjusted defensive efficiency (26.7%). An interesting stat here is that their average possession on defense lasted 45.7 seconds, which is the 13th-longest average in Division I. And they allowed the 10th-lowest shot-on-goal rate as well. All signs point to a defense that made opposing offenses uncomfortable.
20. SAINT JOSEPH'S
Levi Anderson finished the year having generated 23.1% of the Hawks’ assists. Given his touches, the 1.7 assists he averaged per-game put him in the 78th percentile nationally. The downside for Anderson was a turnover rate that put him in just the 35th percentile nationally. If he can keep generating offense for others, while cutting out some of the turnovers, this offense could take another step forward in 2023.
Zack Capozzi
Zack Capozzi's career peaked when he scored a goal in a men's league game against a defense that had a guy wearing a Delaware helmet. He (smartly) ended his playing career and now runs LacrosseReference.com where he uses numbers to uncover the hidden stories of college lacrosse.

Categories
Tags
Related Articles


