Beyond the Basics: Depth, Finishing Ability Set North Carolina Apart
Welcome to Beyond the Basics!
My name is Zack Capozzi, and I run LacrosseReference.com, which focuses on developing and sharing new statistics and models for the sport. The folks at USA Lacrosse Magazine offered me a chance to share some of my observations in a weekly column, and I jumped at the chance.
Another season has come and gone. The championship trophy is back in the Tar Heel State. North Carolina avenged its Championship Weekend loss from a year ago en route to the 2022 national title. That the Tar Heels did it by beating Boston College for a third time this season just increases the storybook value for whomever writes the screenplay of this year. I can already see the final scene, after the confetti has been swept and the trophies awarded. Before the credits, someone comes in and says, “Oh, and the finals were the most watched women’s lacrosse game ever ...” End scene.
That’s what strikes me as different about this end-of-season than others. Yes, we are losing some of the stars that have made the game so visible over the past few seasons. But it’s not as if they are gone. They are playing in Athletes Unlimited this summer. And beyond that, there are a whole group of stars ready to take their place and capitalize (and build) on what was the most visible season in the history of the sport.
But enough about the future; this column is devoted to a retrospective of how the Heels got over the hump and won the program’s first national title since 2016.
UNC won its 22 games by an average of 8.3 goals. That scoring margin was third-best in the nation and against a much tougher schedule than either Jacksonville or Loyola faced. They had the best opponent-adjusted offense in the country. The second-best opponent-adjusted defense and the third-best draw control unit. As with Maryland on the men’s side, this was a consistently dominant regular season team that also managed to be great when it mattered in May.
SO MUCH DEPTH
We could all see the brilliance of this offense. The efficiency numbers prove it, but I would argue that the defining feature of this team was depth. Andie Aldave, Olivia Dirks and Sam Geiersbach transferred to Chapel Hill to join an already potent offensive unit that included Jamie Ortega, Scottie Rose Growney, Ally Mastroianni and Caitlyn Wurzburger. The result was a 45 percent opponent-adjusted offensive efficiency rating. That is the third-best mark of any team in Division I women’s lacrosse in the past seven seasons (excluding the shortened 2020 season).
To put the depth in perspective a bit, Ortega led the team in shot attempts; she took 17.8 percent of the team total. Compared to other teams’ highest-volume shooter, that is the fifth-lowest mark in Division I women’s lacrosse. For some teams, spreading shots around is the natural result of not having any great shooters. That’s not the case here; Carolina ended with the best opponent-adjusted shooting percentage in the nation.
Another way to look at depth is as a function of who shined in individual games. I calculate a stat called EGA (expected goals added), which puts all of a player’s contributions into a single number (similar to WAR in baseball). The idea is to go beyond points and incorporate a player’s contributions from scoring as well as things like ground balls and caused turnovers. To measure depth, one way to think about a team is whether one player consistently ended with the top EGA score for a given game or whether it was more dispersed.
In their 22 games, the Heels had a whopping eight different players claim the EGA title at least once. Ortega did it nine times. Growney and Geiersbach both did it three times. Mastroianni and Wurzburger had the top mark twice, and Dirks, Aldave and Elizabeth Hillman each did it once. For point of comparison, Boston College only had three players who took the top EGA spot in at least one game (Charlotte North,18; Belle Smith, three; Jenn Medjid, two).
I am not one who thinks that depth is important for its own sake. It belongs to that class of metrics that can be gamed, which means that it loses some inherent value as a differentiator. Put another way, I don’t think UNC was better than Boston College because they had more players capable of being the leading light. But there’s no doubt that depth does afford you some margin for error from game to game. And over a grueling 22-game season, that’s important.
THAT FINISHING KICK
I don’t think the link between depth and closing ability is as strong as some observers make it out to be. But the Heels’ stats are certainly suggestive in that direction. Simply put, as good as their overall stats were this year, their ability to finish strong deserves mention. Now, “finish strong” can have many meanings, and we’ll hit three of them here.
First, you can’t talk about UNC’s ability to finish without bringing up the come-from-behind victory in the national semifinals against Northwestern.
With 10 minutes left in the fourth quarter, the Wildcats held a 14-7 lead and a 96.6-percent win probability. UNC proceeded to score the final eight goals, completing one of the great comebacks in the history of the sport, both in terms of the improbability and because of what was at stake.
Now that is a single game, and before you accuse me of cherry-picking, we can zoom out and see another way in which the North Carolina finishing kick looks a lot like a defining legacy. As the game progressed, the Heels’ shooters became otherworldly.
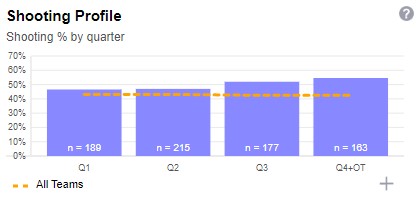
In the first quarter, UNC shot 46.6 percent, which is a bit better than the NCAA average. In period one, this was a decent, but not great, shooting team. In the second quarter, the story is basically the same. In the third quarter, we see things pick up with a 52 percent shooting percentage. But in the fourth quarter, we see glimpses of greatness: the UNC shooting percentage in the period was 54.6 percent.
If that hasn’t convinced you, here’s one final lens through which to view their late-clock brilliance: the shot clock. In the first 30 seconds of the shot clock, UNC shot 40.9 percent, slightly worse than the NCAA average of 41.8 percent. All in all, they went:
-
First 30 seconds: 40.9%
-
40-60: 50.4%
-
20-40: 55.1%
-
Last 20: 59.3%
When time got short, they kicked into gear. For dominant teams, it seems as if upsets and losses tend to be the result of a favorite fading down the stretch. UNC’s prowess late made it very hard for those upsets to happen.