
Welcome to Beyond the Basics!

My name is Zack Capozzi, and I run LacrosseReference.com, which focuses on developing and sharing new statistics and models for the sport. The folks at USA Lacrosse Magazine offered me a chance to share some of my observations in a weekly column, and I jumped at the chance. 

For the final installment of Beyond the Basics, we are going to take a statistical spin through the 2022 Maryland men’s lacrosse championship season. Some have argued that this was the greatest team ever, and those people will certainly find evidence in this piece to support their claim.

I don’t have a way to objectively compare this team against the other contenders for the crown because my data only goes back to 2016. So, while I can’t add much to the 2006 Virginia vs. 2022 Terps argument, I can definitely say that this was the greatest team of the past seven years.

A bit ironic, isn’t it? The fastest game on two feet utterly dominated by the team with the slowest mascot.

NOTHING BUT ONES

The logic behind the above claim is pretty clear cut. There are four primary, top-level metrics that I use to look at the core units of each team, offensive/defensive efficiency, goalie save percentage and faceoff win rate. And of course, I think it’s crucial to use the opponent-adjusted version to account for the fact that top teams play very different schedules.

And when we look at the final ranking for the four Terrapin units, a pattern emerges.

  • The offense finished first nationally with a 41.5 percent opponent-adjusted offensive efficiency

  • The defense finished first nationally with a 20.9 percent opponent-adjusted defensive efficiency

  • The faceoff unit led by Luke Wierman finished first nationally with a 67.3 percent adjusted win rate

  • And the goalies finished the year in (you guessed it) first, with a 63.4 percent opponent-adjusted save percentage

Now of course, if they hadn’t been able to finish it off on Memorial Day, all of that statistical dominance would have been for naught. But now that this team is among those teams with the title “Champion,” we can compare their statistical marks to the other recent winners.

2021 Virginia had three out of four units that finished in the top 10, but the best ranking they achieved was in goal and at the faceoff dot (both of those units finished No. 7). 2018 Yale also had three top 10 units, but their goalies finished ranked No. 39. 2017 Maryland is probably the closest to this year’s team with the third-ranked offense, third-ranked goalies and fifth-ranked defense. 2016 UNC had the No. 48 defense and the No. 37 goalies, but the Tar Heels were the only other team beside 2022 Maryland to have a unit ranked first (their offense).

Let’s summarize. Only one of the other champions in recent years had even one unit ranked first nationally. Only two even had a top-five unit. John Tillman’s team was ranked first in all four statistical categories.

These other teams were hot at the right time, and this is certainly not to diminish their banners, but no team in recent memory has combined the consistency over a full season AND a four-game run ending in a Memorial Day dogpile.

MOP-IN-NET

Player legacies are written in May. I don’t think that’s as true of teams, though. See above: the discussion of best teams first looked for teams that won the title and then sorted them based on their whole-season stats. We don’t differentiate a team’s successes based on how they did in May only. But for players, it’s a different story.

An enduring player legacy can be written in two ways. You can be someone with an eye-popping career total (most points, most goals, etc). Or you can be someone whose postseason successes led to a team championship. Logan McNaney falls into the second category. Take a look at the season-long trend for Maryland in terms of opponent-adjusted save percentage.

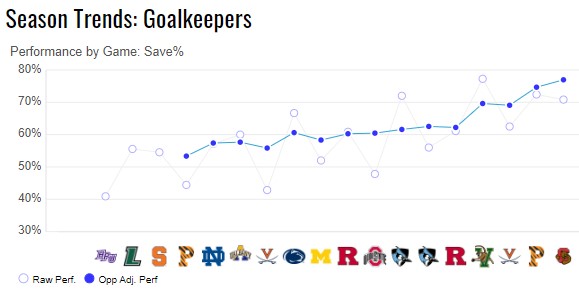
Through the end of April, the picture, after accounting for their opponents, was of an improving, but not elite, unit. Impressive, but McNaney’s play through the end of the regular season was not at the level of the per-possession efficiencies or the faceoff successes. And then the calendar flipped to May.

Through four NCAA tournament games, McNaney and crew put up an opponent-adjusted save percentage of 76.9 percent. In terms of per-possession efficiency, the offense faded a bit during the postseason. And at the end of the Cornell game, it was clear that the defense was exhausted. The McNaney saves in the championship game provide the bedrock of a great legacy, but the steady increase in his play throughout the year shouldn’t be overlooked as well.

When I look at Maryland overall, the story is one of consistency. When I look at McNaney in particular, it’s consistent improvement culminating in brilliance when it mattered most.

RED REDEMPTION

As I mentioned, it’s hard to pinpoint any one unit as being primarily responsible for the trophy heading back to College Park. You can win a title with an offense that covers up flaws on defense or at the faceoff stripe. Prior to the shot clock era, faceoff success could cover up a lot elsewhere. The 2022 Terrapins clearly did not have any part of their team needing to be bailed out. But looking at 2022 in a vacuum loses some of the richness of this story.

In reality, while the absolute level of success was similar across all units, it’s clear that the dominance of the 2022 team, relative to the 2021 vintage, was driven by massive improvements from the specialists. The 2021 Terps finished 26th in adjusted save percentage and 27th in adjusted faceoff win rate.

And whether it’s fair or not, the enduring image of the 2021 Maryland team was a shot by Luke Wierman saved by Alex Rode as the clock counted down toward zero against the Cavs in last year’s title game. It’s fitting, then, that while McNaney won MOP, it seems like the most prominent redemption narrative for this team was the juxtaposition of Wierman with Tillman last year against the photo of him surrounded by trophies this year.

But there are two components to a faceoff unit — the FOGO and the wings. As with most stats, it’s hard to decouple the two. In many cases, FOGOs get credited with wins that their wings are responsible for. But in keeping with the theme of consistency, the Terps seem to have cracked the code at the faceoff stripe on both dimensions.

Here’s a stat: when the FOGO picked up the ground ball on a faceoff win, the Terps won 63 percent of those draws. When the wings were the ones that picked up the ground ball, the Terps won…63 percent.

And to be honest, the No. 1 ranking for faceoff win rate probably undersells the faceoff unit. I have a stat for faceoff conversions, which measures how often a faceoff win is converted into an actual offensive possession. After all, if the FOGO wins the draw and then chucks it over the head of a teammate, did you really win the faceoff?

Fortunately, for Maryland, their conversion game was nearly as good as their success at winning the initial draw. Maryland converted 97.7 percent of their faceoff wins into actual offensive possessions (No. 4 nationally using the adjusted number). And their opponents were only able to convert 95.5 percent of their successful wins into actual offense (again, No. 4 using the adjusted number). So yes, they won the most draws, but almost nobody was better at turning those wins into offense and stealing possessions back from opponents.

UNDERSTATED BRILLIANCE OF WISNAUSKAS

That we’ve gotten this far and haven’t yet mentioned the 2022 men’s Tewaaraton Award winner, Logan Wisnauskas, is a testament to the balance and depth of this Maryland team. Maryland had six players generate at least 10 percent of their total team assists. Only one team, since 2016, has had more players with at least 10 percent of their assists (2019 Bucknell).

Although it’s not necessarily the case with Wisnauskas (he did win the Tewaaraton, after all), team depth can sometimes overshadow individual brilliance. So, let’s look at Wisnauskas’ rate stats to see where he ranks within Division I men’s lacrosse.


Among Tewaaraton Watch List candidates, only Matt Brandau finished the year with a higher efficiency mark (as measured by usage-adjusted-EGA). But the depth of the Terps’ attack clouds some of Wisnauskas’ achievement this season. For example, he finished with 61 goals, five behind leader John Piatelli. But Piatelli took 186 shots (35.4 percent shooting), where Wisnauskas took just 125 shots (48.8 percent shooting).

THE BEAUTIFUL-ER GAME

As much fun as it is to follow the stats that lacrosse teams generate, we are all drawn to this game because of the excitement of watching the players on the field do amazing things. This Maryland team was one of the more fun teams to watch in recent memory. The ball movement was a thing of beauty. And seeing them finish it off with a title after such a dominant season was oddly satisfying.

I’m not sure when we’ll see another team come as close to perfection as Tillman’s bunch did this year. I certainly don’t expect to see another team finish ranked No. 1 in every major statistical category. But one can hope.

Anyway, since this is the final Beyond the Basics of the season, I have to say thank you to the USA Lacrosse Magazine folks for giving me space to share my thoughts and to you, dear reader, for following along. Until next time …

LACROSSE STATS RESOURCES

My goal with this column is to introduce fans to a new way to enjoy lacrosse. "Expand your fandom" is the mantra. I want you to walk away thinking about the players and stories presented here in a new light. But I also understand that some of these concepts can take some time to sink in, especially when they are presented without the underlying context.

To help this process along, I have several resources that have helped hundreds of lacrosse fans and coaches to internalize these new statistical concepts. The first is a Stats Glossary that explains each of my statistical concepts in more detail than I could fit here. The second, is a Stats 101 resource, which provides context for each of my statistics. What is a good number? Who’s the current leader? That’s all there. And last, I would love to hear from you. If you have questions or a suggestion for a future column, please reach out.